Case study›Solar · Bay Area · CallTools
122 appointments in three weeks, and a file ranked on every one of them
Eleven agents, three 25,000-record files, three weeks, 122 appointments — and a call log that changed how the next file was picked. The third was ranked on what had already booked, before anyone dialed it, and out-booked the first by 36% on the same number of passes.
- Who
- A California solar call center
- Sells
- Solar appointments for an installer, by phone
- Market
- San Francisco Bay Area
- Team
- 11 agents, in-house
- Dialer
- CallTools predictive
- Files
- Three, 25,000 records each

Measured in the floor's own CallTools account and published with the method. Last re-read September 21, 2026.
Three files, three weeks
On August 31, eleven agents at a Bay Area solar call center started dialing 25,000 homes we had picked for them. They got a second 25,000 on September 8 and a third on September 15. By the end of the third week they had made 348,858 outbound calls on those numbers and booked 122 homeowners into an appointment.
Here is the whole run on one axis, coloured by which file the number came from.
The weeks read 32, 36 and 54. Nothing about the floor changed in week three: same agents, same dialer, same hours, same market. What changed is that by then every number on the dialer had been chosen by a model built out of the first two files’ call logs — and that is the whole story on this page.
We asked for the call log, not a testimonial
The usual way a data vendor finds out how a file did is to ask, and the usual answer is “pretty good.” We asked for the export instead. Their dialer hands back every call through its API, so we pulled all 348,858 of them page for page, reconciled the totals against the dialer’s own per-day counts, and joined them by phone number to the three files we had shipped.
That turns an opinion into a record: every dial, what the agent tagged at the end of it, how long it ran, and which of the 75,000 homes it belonged to. Every count below is theirs, read back.
The first thing it showed us was what an hour on a cold file really looks like, and it is not flattering to anybody.
Four calls in five never reach a conversation
Every call an agent finished got a disposition, and across three files that is 14,741 agent-tagged calls. This is the whole mix, and it is worth seeing whole rather than as the two or three slices a vendor would rather show you.
The sliver on the right is the part that is ours to own: numbers that were wrong or dead (3.40%), and people who could never have bought — a renter (1.43%) or a home that already had panels (0.98%). Everything to the left of it is what cold calling is.
A call that does end in an appointment does not sound like the others. It runs seven and a half minutes at the median against twenty seconds for an ordinary connect. The best hour is 2 pm, noon and 6 pm are next, and a quarter of the bookings land after five o’clock.
The third dial books more than the first
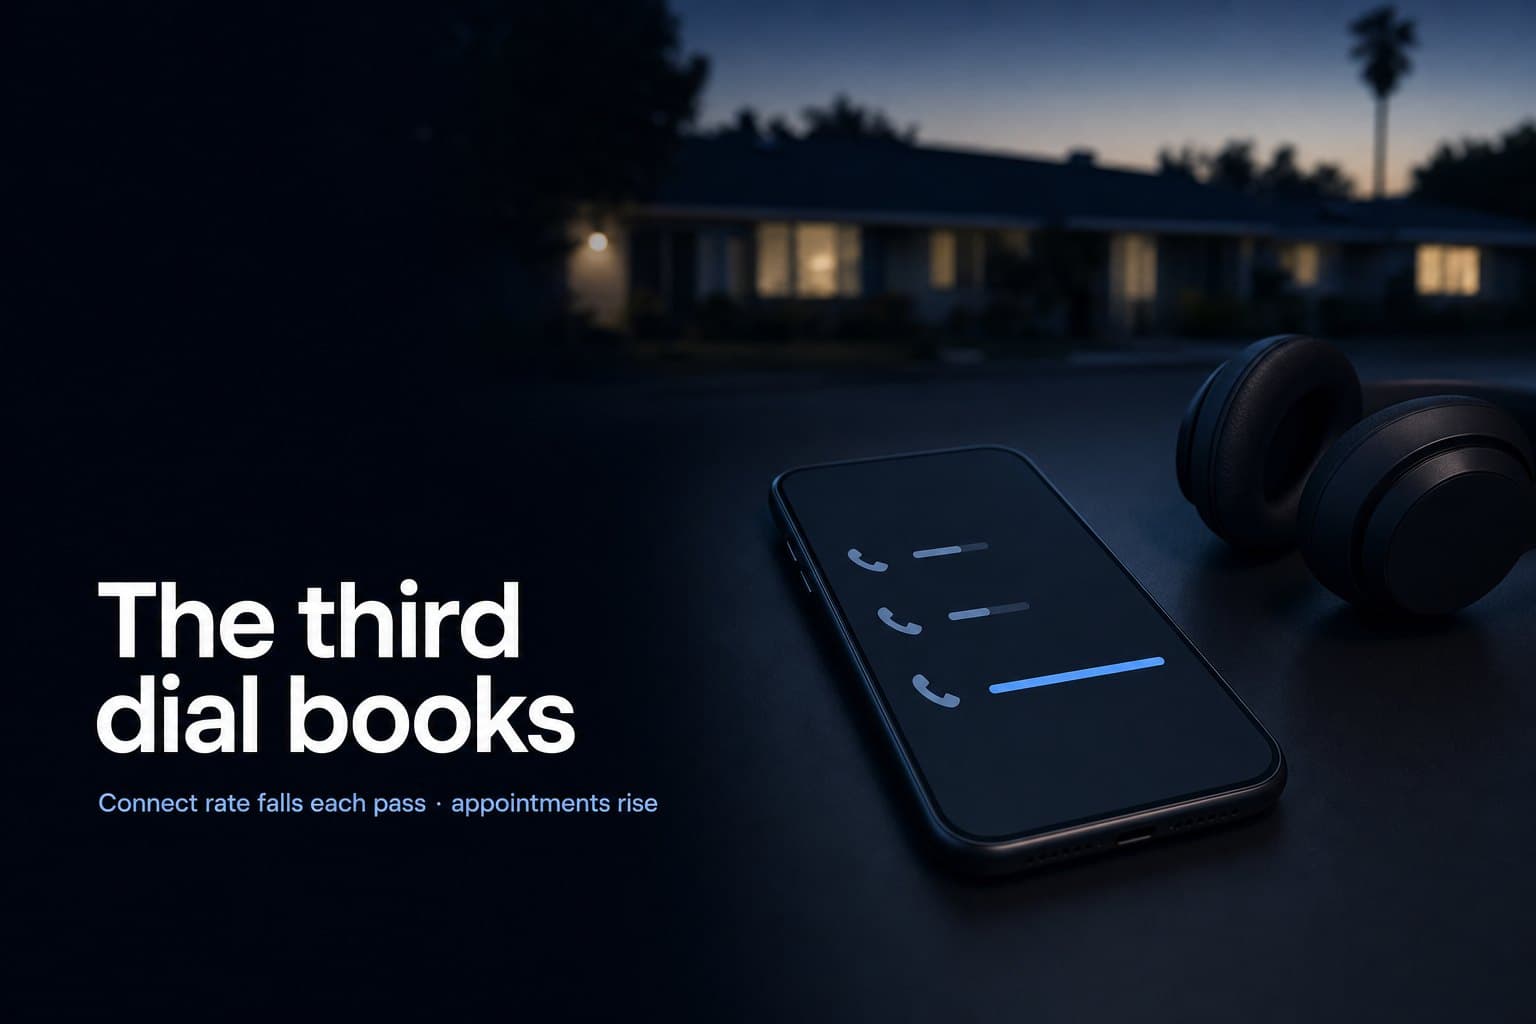
The next thing the log settled is an argument every floor has with itself: when is a record spent? Pickup falls with every pass, as it does on any file, so it feels spent quickly. Appointments say otherwise. Per live connect, the third dial booked 1.9 times what the first one did, and passes four through six added 31 more bookings after that.
Who books is not who installs
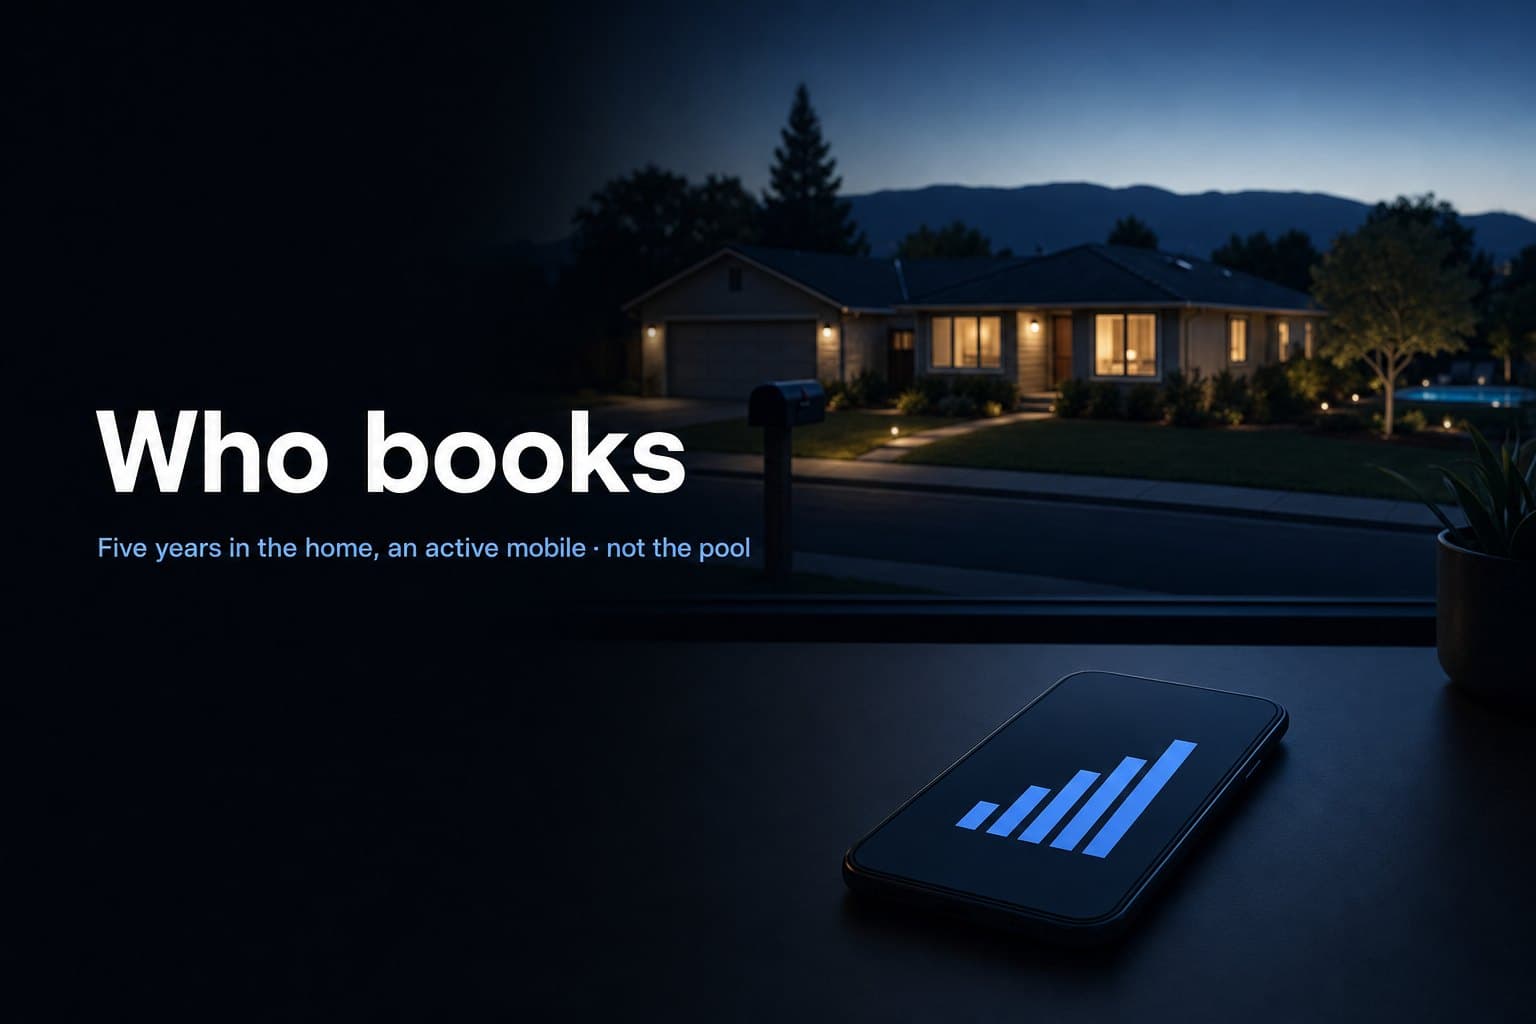
Then we joined every appointment on the first two files back to the record behind it and asked what those homes had in common. Five traits separated them from the homes that did not book, each adjusted for the others. Two — phone activity and time in the home — we had never ranked a file on before.
The pool is the one that stopped us. Pool homes pick up at a normal rate and almost never book. They are also one of the strongest predictors of who installs solar, which is exactly what the first file had been built on. We had sent a file that was right about the wrong question: who installs and who books a cold call are not the same list.
Checked backwards before we bet a file on it
Five traits found after the fact will always look convincing, so we ran a check: we scored the second file using weights learned on the first file alone, and looked at where its bookings actually fell.
The top fifth booked 2.8 per 1,000 records. The bottom three fifths, together, booked 2 of 25. Encouraging — but still a test run on files we had already watched being dialed, which is why the third file was built to settle it properly.
23 of 25 bookings in the top 40% of a ranked file, on 24,968 records, 25 bookings. Weights from the first file only; the five traits were chosen looking at both.
September 15: a file nobody had dialed yet
For the third file we scored the whole eligible Bay Area pool on those traits, kept the top 25,000, and shipped it without knowing how it would do. It has been worked three passes where the first two have had six, so the only fair comparison is all three files at the same dialing depth.
+36% more appointments per record than the first file, on the same number of passes, from a score fitted before a single number on it was called. It is most of the 54-appointment week at the top of this page, and it is the whole argument for sending us the export: the first file was built on who installs solar, the third was built on who answers and books, and the difference is worth a third more appointments for the same dialing.

Two things we had to correct along the way
The floor told us the second file was much better than the first, and at matched depth it was — 32 appointments against 25. But not by as much as it felt. What really changed was the texture of the conversations: scheduled callbacks nearly doubled and “doesn’t qualify” fell by a third. Only 3.4% of the numbers that asked for a callback ever booked. Warmer calls feel like a better list; they are not the same thing, which is why we grade on appointments set.
The second correction is ours. A week ago this page said 88 appointments. The dialer holds 144 calls tagged Appointment Set, and they sit on 122 different homes: on every repeat, the same agent rings the same number back a median of two days later for about a minute and tags it again. That is the confirmation call, not a second appointment. Counting rows would have credited this floor with 22 appointments it never booked, so every figure here — and the floor’s own before-we-arrived numbers we compare against — counts one booking per household.
On its own window, the read that produced 88 holds 89 rows on 76 households. The published figure was high by about a sixth. We would rather correct it here than leave a number standing that a customer could not reproduce from their own export.
Before us, and after
What to take to your own call center
Work every record three times. Connects fall with each pass; bookings per connect rise through the third, and passes four to six still produced a quarter of the total. Replace the file after the third dial, not the first.
Rank on phone activity and time in the home. A mobile with carrier activity in 5 of the last 12 months and an owner in year zero to five each roughly triple bookings per record. Skip pool homes.
Count appointments by household. A dialer re-tags the same contact on the confirmation call. Count dispositions instead of homes and you will report a number your own export cannot reproduce.
Send the export. Every finding above came from the dialer’s own log joined to the delivered file. That is how the third file got ranked, and why it out-booked the first.