Case study›Solar · New Jersey · ReadyMode
18 deals and about $200,000 in a month, every one from a cold call
Eighteen months of cold calling into a Florida market that had stopped paying, then the floor moved its dialing to New Jersey. August: 18 power-purchase agreements, about $200,000 in commission, every one from a cold call — on a file whose answer rate and calls to connect graded strong on all 22 days in their own dialer.
- Who
- A New Jersey solar call center
- Sells
- 25-year solar power-purchase agreements, by phone
- Market
- New Jersey today, Pennsylvania next
- Team
- ~30 dialers
- Dialer
- ReadyMode AI predictive, 4 to 6 lines per agent
- Volume
- 5,000 to 10,000 dials a day, 14,000 on a big one
Measured in the floor's own ReadyMode account and published with the method. Last re-read September 15, 2026.
Eighteen months in the wrong state
A 25-year solar power-purchase agreement is a $50,000 to $100,000 decision about the roof over someone’s head, and this floor sells them to people who did not ask to be called. About thirty dialers. A predictive dialer running four to six lines each. Five to ten thousand calls on an ordinary day, fourteen thousand on a big one.
For eighteen months most of that dialing went into Florida, and Florida was closing on them. Financiers cut their pricing by about 40%. Installers raised theirs. Power got cheaper, which takes away the one argument that sells itself. The owner spent a year and a half banging their head against a market where the math had stopped working, and no month in it looked like the one that came next.
Then the floor moved its dialing to New Jersey, onto our files, and August happened.
Then August
Eighteen power-purchase agreements closed inside one month for about $200,000 in commission, the biggest month this floor had had in eighteen months of cold calling. Not one of the eighteen came from a form, a referral or a knock. Every one of them started as a cold call on a record we delivered.
August helps, the owner said: it is the month everyone opens a big electricity bill. But the sentence they kept coming back to was not about the total.
It doesn’t feel like a one-off. It feels like we’ve got a system.
A system is a claim you can check, and this floor checks it on its own equipment. The rest of this page is what their dialer’s report says about the file that month ran on — 107,574 calls of it, August 1 to 22.
They grade a file before they trust it
The owner does not take a data vendor’s word for how a list performs. Every list that goes on this floor gets graded on three numbers out of the dialer’s own historic report: how often a call is answered, how much of that is an answering machine, and how many calls it takes to put a live person on an agent’s line. The weak, medium and strong bands are theirs, set from every vendor they had dialed before us. They existed before we shipped a single record.
Here is where our records landed against those bands. Calls to connect came in at 4.58 against a bar of 7, and the answer rate has never come in under their 66% line. The owner pointed to files running 3.3 and 3.7 calls per pickup, and called that insane.
Scout Data vs. the floor’s own bands
One of those three numbers needs a caveat we would rather make than be caught not making. This report counts an answering machine as answered, so an 80% answer rate is not 80 people in 100. Take the machines out and 21.84 dials in 100 put a human being on the line — which is the same thing the 4.58 figure says from the other direction.
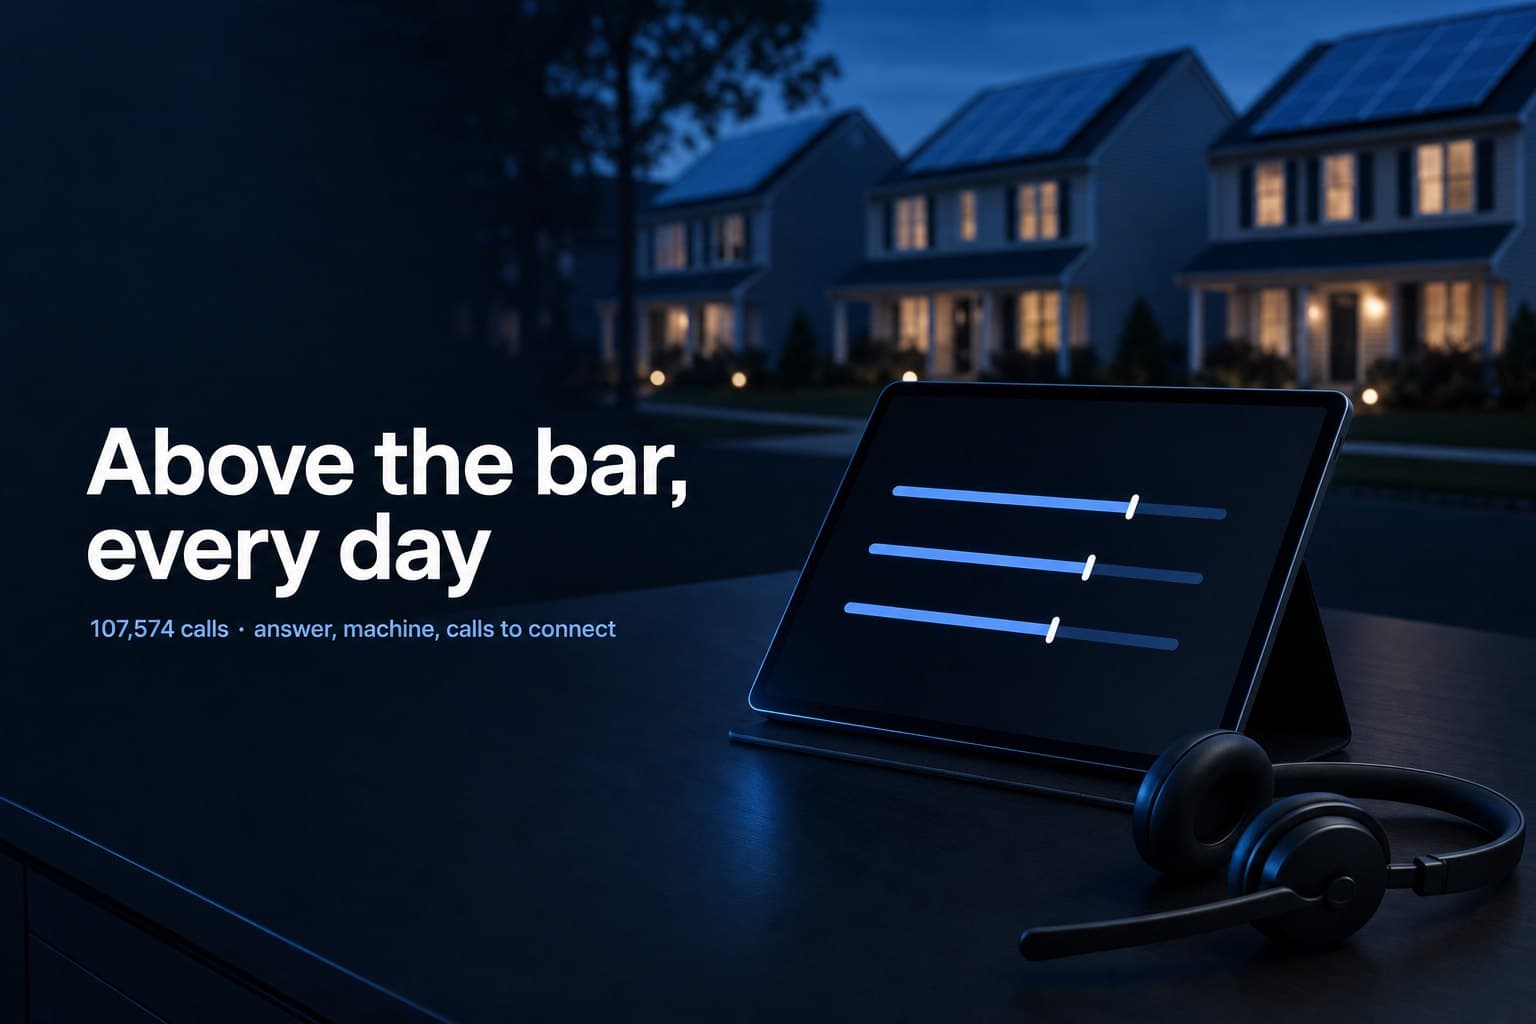
4.58 calls per live pickup, 80.0% answered, machines included, 72.7% of answered calls hit a machine, on 107,574 calls, Aug 1–22, 2026.
Twenty-two days, one at a time
A three-week total can hide a bad week inside a good month, so the floor reads the report a day at a time and so do we. Answer rate and calls-to-connect graded strong on every one of the 22 days. Machine rate graded strong on 16, medium on 4 and weak on 2 — both of them light-volume weekend days.
Answer rate
Machine rate
Calls to connect
Show the daily numbers as a table
| Day | Dials | Answer rate | Machine rate | Calls to connect |
|---|---|---|---|---|
| Sat Aug 1 | 840 | 85.5% | 75.5% | 4.77 |
| Sun Aug 2 | 333 | 84.4% | 78.7% | 5.55 |
| Mon Aug 3 | 7,524 | 69.3% | 72.2% | 5.19 |
| Tue Aug 4 | 5,911 | 82.5% | 71.7% | 4.28 |
| Wed Aug 5 | 3,425 | 82.2% | 62.5% | 3.25 |
| Thu Aug 6 | 8,919 | 80.3% | 73.9% | 4.77 |
| Fri Aug 7 | 6,132 | 82.2% | 72.6% | 4.44 |
| Sat Aug 8 | 1,366 | 80.2% | 70.4% | 4.22 |
| Sun Aug 9 | 243 | 87.2% | 65.6% | 3.33 |
| Mon Aug 10 | 6,526 | 81.0% | 72.6% | 4.50 |
| Tue Aug 11 | 4,527 | 83.1% | 71.7% | 4.25 |
| Wed Aug 12 | 4,094 | 82.4% | 72.2% | 4.36 |
| Thu Aug 13 | 5,994 | 81.7% | 73.4% | 4.59 |
| Fri Aug 14 | 4,367 | 82.7% | 71.8% | 4.29 |
| Sat Aug 15 | 2,055 | 86.8% | 71.9% | 4.10 |
| Sun Aug 16 | 3,695 | 86.5% | 75.4% | 4.69 |
| Mon Aug 17 | 6,875 | 78.7% | 75.8% | 5.25 |
| Tue Aug 18 | 5,421 | 82.0% | 69.5% | 3.99 |
| Wed Aug 19 | 8,889 | 78.2% | 73.8% | 4.88 |
| Thu Aug 20 | 10,361 | 78.8% | 75.6% | 5.19 |
| Fri Aug 21 | 7,353 | 76.7% | 69.7% | 4.31 |
| Sat Aug 22 | 2,724 | 76.7% | 78.2% | 5.97 |
Against the lists they were already buying
Clearing a floor’s own bar is one thing. Beating the other lists the same agents dial, on the same dialer, in the same month, is the comparison that decides whether a vendor gets bought again. Their segment tracker splits August into 15 list segments — four of ours and eleven from the two vendors they already buy — and counts live pickups per 100 calls on each.
None of it was a first dial
Nothing above is a first-touch number. Every list in that report had already been worked about three times, on a predictive dialer running four to six lines per agent, before it was graded. A file that looks good on its first pass and dies on its third flatters the vendor who sold it; these are third-pass numbers.
The floor also rules out the one thing that impersonates a bad list. A flagged caller ID sounds exactly like bad data from the inside — nobody picks up, and the file takes the blame — so they re-register their outbound numbers daily and check them before they blame the file. Of their 640, 3 were flagged by every carrier. Thursday is their best day by a distance; mid-morning and late evening are the windows.
The file stopped being the thing they worry about
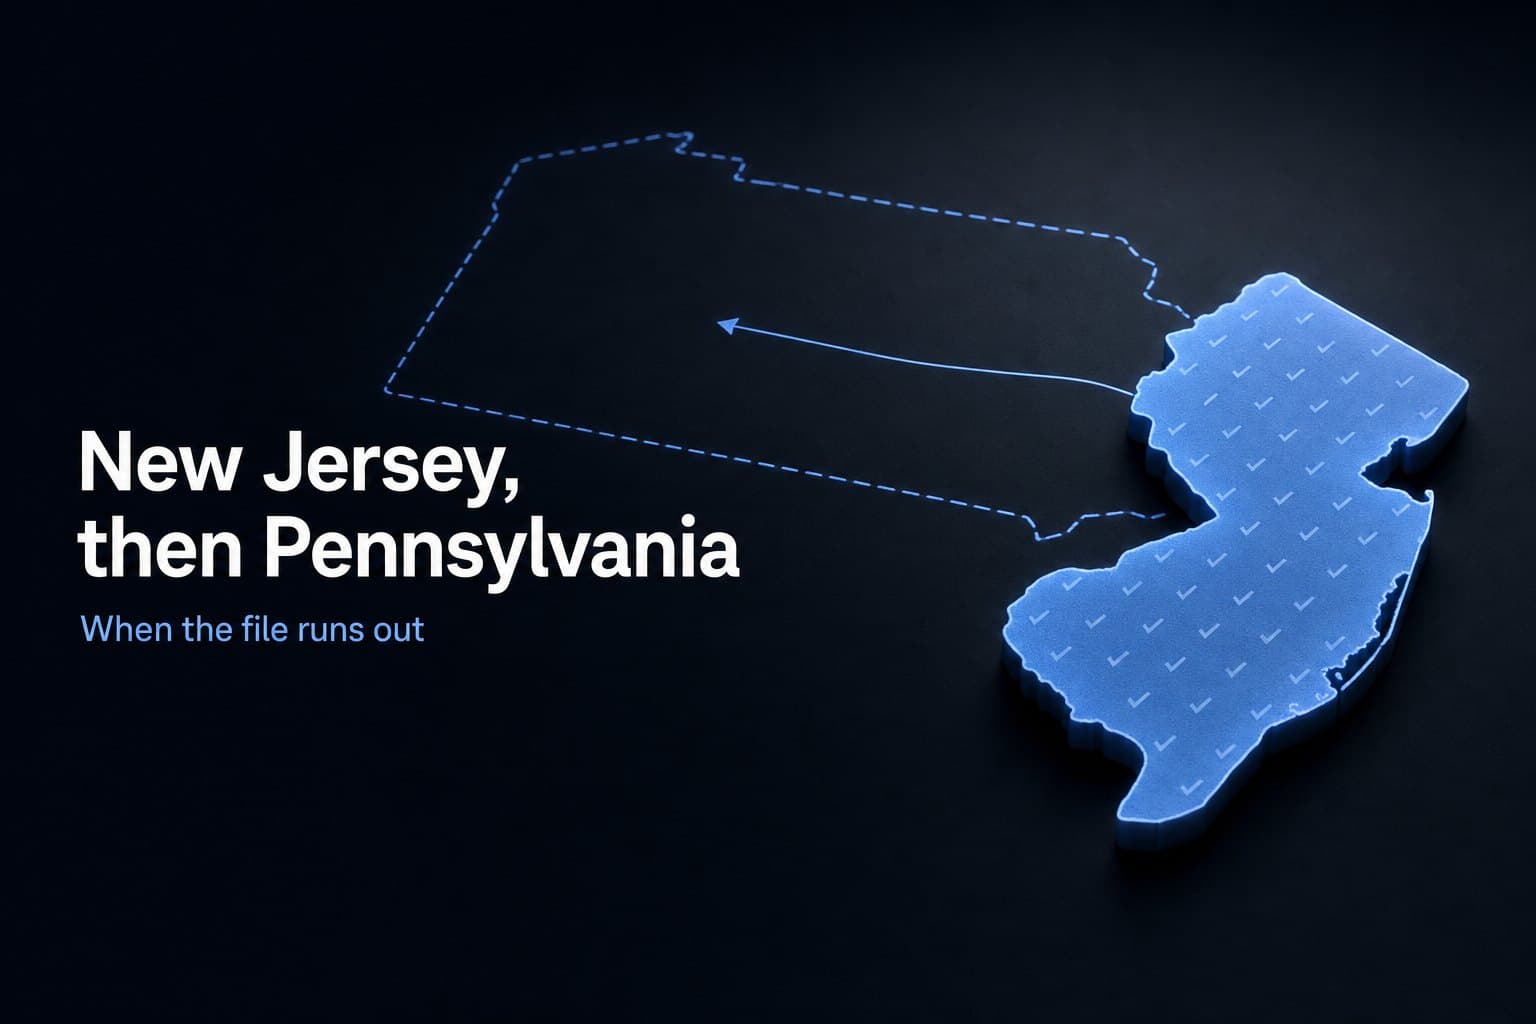
The clearest signal in any of this is not a number. Ask the owner what is in the way now and the answer is not the data. In their words the file is good enough, and what matters now is the script, the show rate on presentation calls, and getting pricing systems higher. When New Jersey runs out, the floor flows straight into Pennsylvania.
What they needed, and what they got
What to take to your own call center
Grade the file on your dialer’s own numbers. Answer rate, machine rate and calls to connect, against bands you set before you dial — not against what the vendor tells you afterwards.
Read it day by day. A 22-day total hides the light weekend days where machine rate drifts, and it hides a bad week inside a good month.
Work a list about three times before you judge it. These numbers held on the third pass, not the first.
Check your own caller IDs before you blame the data. A flagged number is silent in exactly the way a dead file is.